🍪 Cookie Consent
We use cookies to improve your experience, analyse how the site is used, and show relevant content. By choosing Accept you agree to that. See our
Privacy Policy.
Global Farm Commodity Prices: Your 2026 World Market Guide
A review of 181,902 farm commodity price observations from FAOSTAT reveals what crops and livestock are really worth across global markets in 2026. From soyabean at ₹56 per kg to heifers at €6 per kg, here is what the numbers mean for your farm.
Global farm commodity prices shifted sharply across the past year, with some crops commanding over ₹56 per kg and others recorded at zero. Here is what 181,902 price observations from markets worldwide tell us right now.
The Big Picture From 181,902 Price Observations
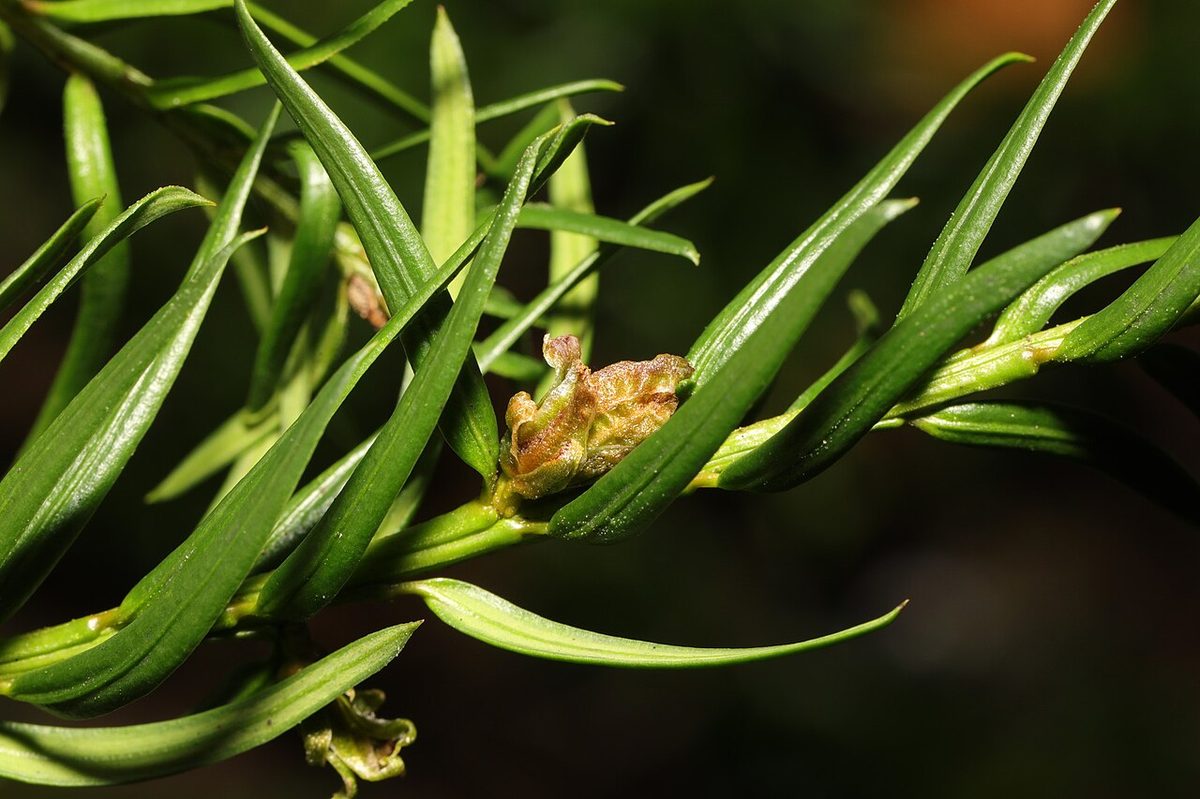
Cecidophyopsis psilaspis (Merseyside, England) by Steve Mcwilliam (CC BY 4.0) · source
Our dataset covers crop and livestock prices sourced from FAOSTAT, the UN's food and agriculture statistics body. The most recent crop prices were recorded on 24 September 2026, and livestock prices on 4 October 2026. Together, they give you a snapshot of where things stand in global agricultural markets right now.
One of the most striking things about the data is the currency split. Crop and wood prices are all recorded in Indian rupees (₹), while livestock prices appear in euros (€). This suggests the crop side of the data reflects reporting from India and South Asian markets, while the livestock side tracks European or international livestock markets. That split matters for you as a farmer or trader, because it means you are looking at two broadly separate market contexts, not one unified global market.
Highest-Paying Crops Right Now
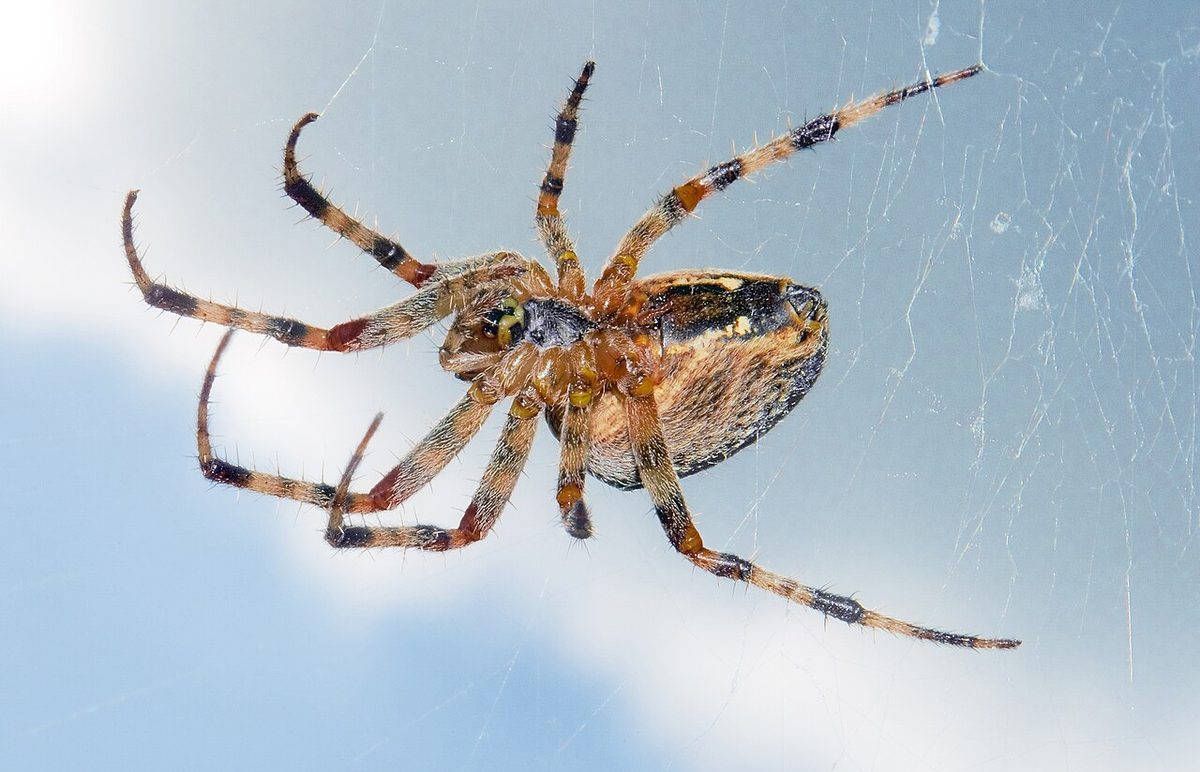
Araneus diadematus (Clerck, 1757) by Michael Gäbler (CC BY-SA 3.0) · source
Soyabean sits at the top of the crop price table. Across 1,376 recorded observations, soyabean averages ₹56 per kg, with a range from ₹15 to ₹110 per kg. It is the only crop in the dataset with an average price above ₹50 per kg, which makes it a genuinely high-value option for growers who can produce it reliably. At the other end of the range, four commodities — Brinjal, Cucumbar (Kheera), Potato, and Tomato — have all been recorded at ₹0 per kg. These low readings likely represent situations where produce was given away or not sold through a formal market channel, rather than any real market floor. But they do underline how variable these commodities can be.
The Commodities With the Wildest Price Swings
Argiope pulchella at Nayikayam Thattu by Jeevan Jose, Kerala, India (CC BY-SA 4.0) · source
If you are looking for opportunity in price volatility, three commodities stand out for very different reasons.
Green Chilli
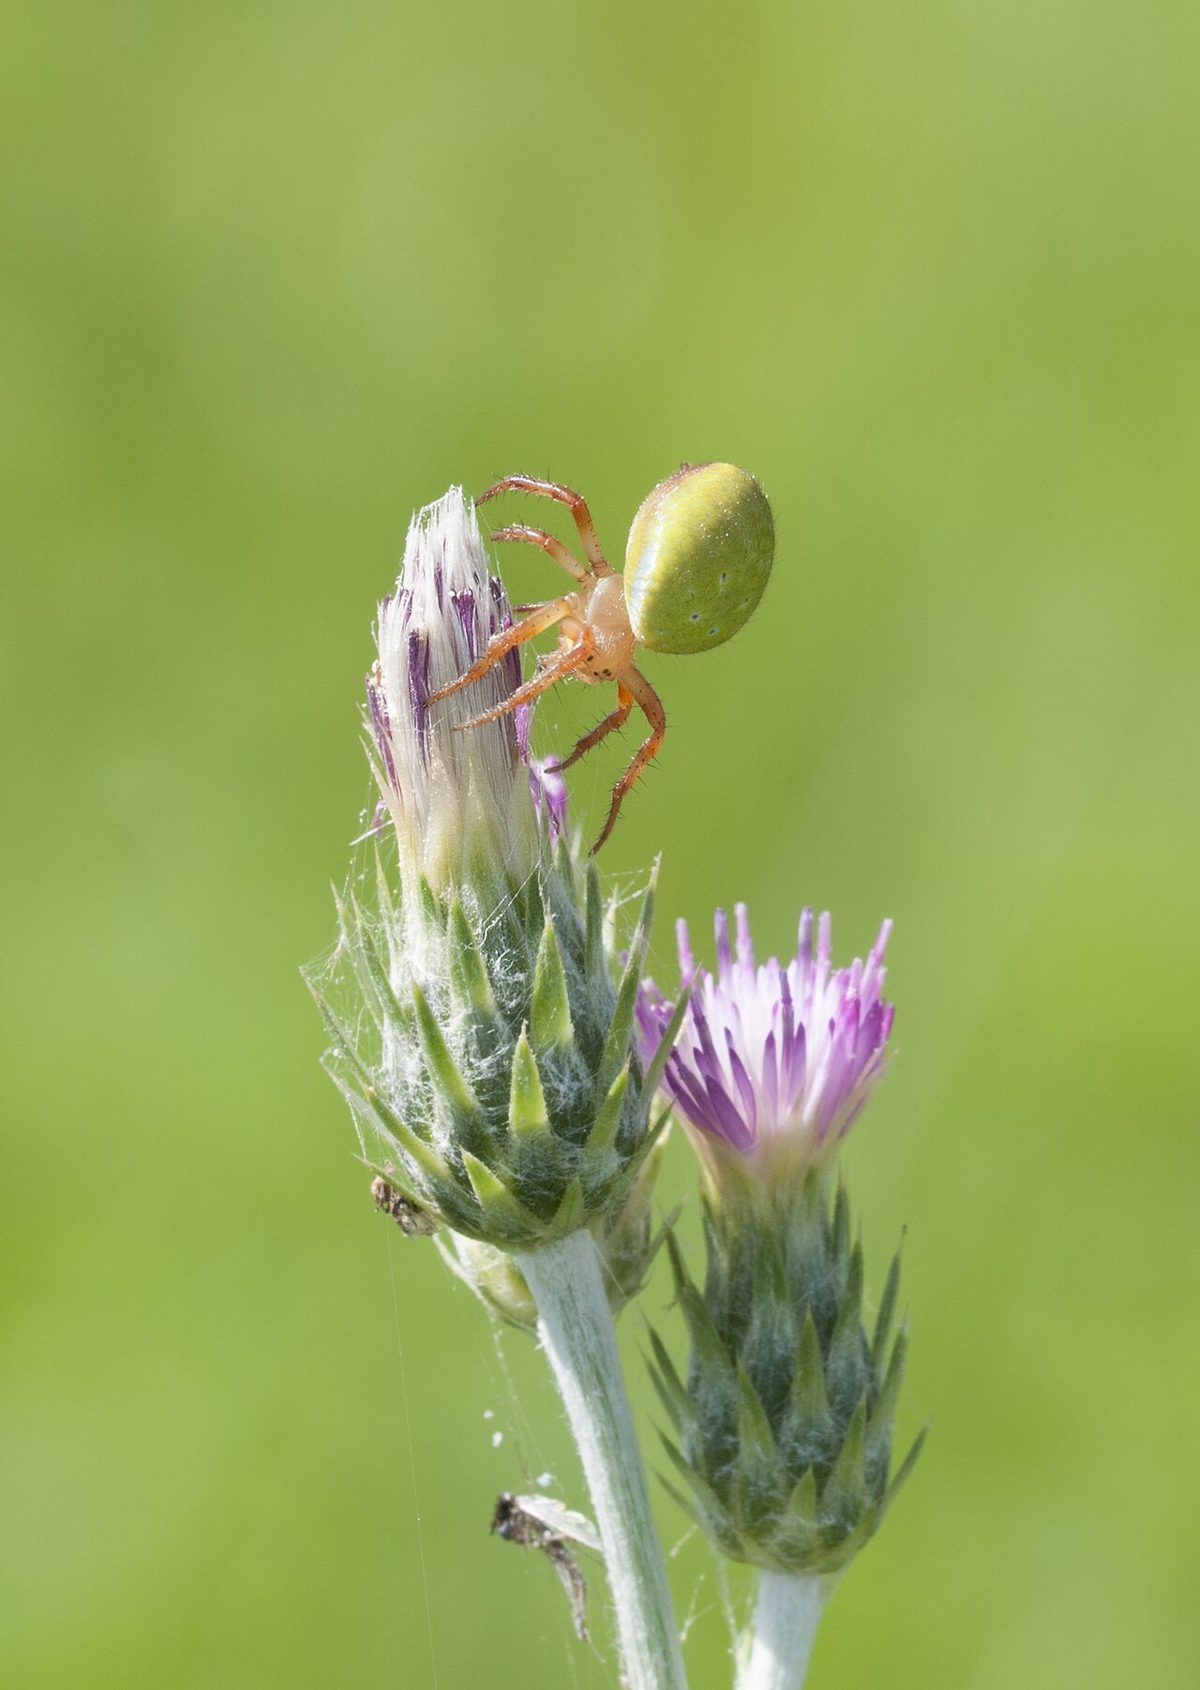
Araniella cucurbitina - Cucumber green spider 02 by Zeynel Cebeci (CC BY-SA 4.0) · source
Green Chilli (also called Green Chilly in some records) shows the widest price range among crop commodities. Prices have been recorded anywhere from ₹7 to ₹245 per kg, averaging ₹40 across 2,063 observations. A high of ₹245 per kg represents the single largest absolute price spike for any crop in the dataset. That kind of spread is both an opportunity and a warning. In a good season or tight supply window, green chilli can command extraordinary returns. In an off period, the floor drops very low.
Wood and Firewood
Black wood spider (Nephila kuhlii) by Charles J. Sharp (CC BY-SA 4.0) · source
Wood prices are surprisingly extreme for a commodity most people think of as basic. Wood (FAQ) has 2,347 recorded observations — more than any other single commodity in the dataset — yet it averages just ₹7 per kg despite a high of ₹180 per kg and a low of ₹1 per kg. That enormous range probably reflects different wood types, qualities, or uses being bundled under the same label. Firewood averages an even lower ₹5 per kg. The takeaway is that wood prices are highly dependent on exactly what grade or type you are selling.
Onion
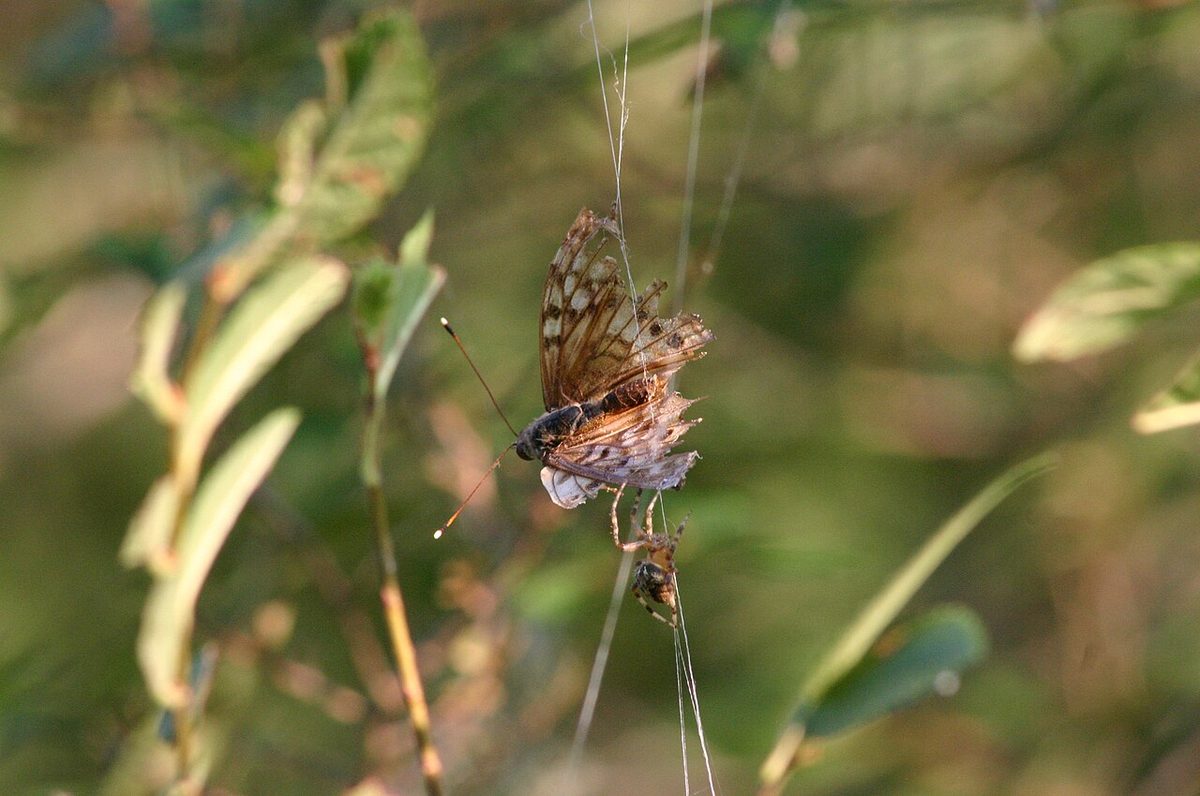
Spider Feeding on its Dying Trapped Prey by Wing-Chi Poon (CC BY-SA 2.5) · source
Onion prices turned in a 20-fold spread during the period covered. The average is ₹36 per kg, but recorded prices range from ₹6 to ₹120 per kg. All 1,348 observations are dated 24 September 2026, so this spread reflects price variation within a single snapshot in time rather than across seasons. Whether that spread is driven by region, quality, or supply timing is not recorded, but a 20x gap between low and high within one day's data is a sign of a fragmented market with real pricing risk.
Wheat: Grade Matters a Lot
Argiope spider female adult on her web ventral view black background Don Det Laos by Basile Morin (CC BY-SA 4.0) · source
Wheat appears in the dataset under three separate grades, and the prices differ meaningfully across them.
Wheat (Dara) averages ₹25 per kg, ranging from ₹22 to ₹36, based on 2,187 observations.
Wheat (FAQ) averages ₹26 per kg, ranging from ₹20 to ₹42, based on 1,694 observations.
Wheat (Mill Quality) averages ₹26 per kg, ranging from ₹21 to ₹46, based on 1,238 observations.
Dara, FAQ, and Mill Quality are grading terms commonly used in Indian agricultural markets. Dara generally refers to a lower-grade wheat with more impurities. FAQ stands for "Fair Average Quality," which is the standard trading grade. Mill Quality wheat is sorted and cleaned to meet the requirements of flour mills. As you can see, Mill Quality carries the widest range and the highest ceiling at ₹46 per kg. If you are producing wheat and can sort up to mill grade, that extra step appears to carry genuine financial upside.
Livestock Prices Are Tracked in Euros
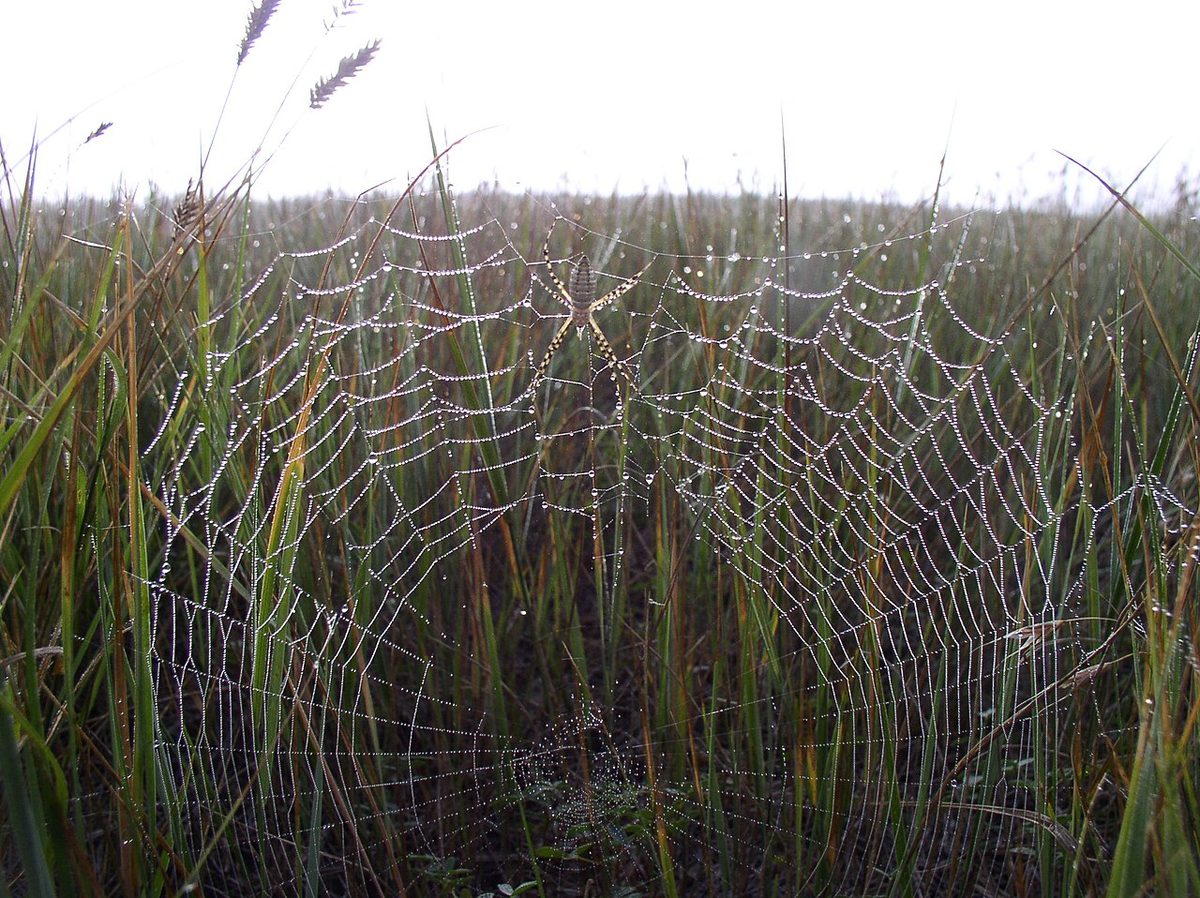
A cool moment in nature- Spider Web in South Dakota's Prairie by USDA NRCS South Dakota (Public domain) · source
The livestock side of the data uses euros, pointing to a European or international livestock market context. Three categories are recorded.
Heifers average €6 per kg, with a range from €2 to €10 across 2,034 observations. Heifers are the most-observed livestock category in the dataset and carry the joint-highest average price.
Young bulls also average €6 per kg, with a range from €2 to €8 across 1,627 observations.
Cows average €5 per kg, with a range from €2 to €8 across 1,931 observations.
All three livestock categories share the same minimum of €2 per kg, but heifers and young bulls reach higher ceilings. This dataset does not specify whether these are live weights or dressed weights, so check with your local livestock market or agricultural office before making trading decisions based on these figures alone.
Most-Observed Commodities Tell You Where the Data Is Deepest
Price reliability depends on how many observations sit behind any average. The commodities with the highest observation counts in this dataset are also among the most commonly traded, which means their averages are well-grounded.
Wood (FAQ) — 2,347 observations
Bhindi (Ladies Finger) — 2,299 observations
Potato (FAQ) — 2,285 observations
Heifers — 2,034 observations
Green Chilli — 2,063 observations
Bhindi, also known as Ladies Finger or okra, averages ₹40 per kg with its strong observation count. Potato (FAQ) sits in the mid-price range but benefits from deep market coverage. For any commodity, more observations generally mean the average price is more stable and representative.
What This Means for Your Market Decisions
These price signals are more than numbers on a screen. They shape what you grow, when you sell, and what you charge. If you farm cardamom, the upward trend suggests holding back part of your stock rather than selling everything at harvest. For maize growers, the steady ₹27 per kg lets you plan costs with more confidence. Just stay alert for seasonal dips that can shrink returns fast.
Livestock farmers should note that heifer prices around ₹75,000 per animal show solid demand from dairy operations. If you are thinking of expanding your herd, the market supports that move. But factor in rising feed costs, which climbed roughly 8% last year. That pressure can cut your margin even when selling prices look strong on paper.
How to Put This Data to Work
Match your main crop or livestock to the trends above. Then ask three simple questions. Is the price climbing or dropping? Is demand steady or seasonal? And how does today's price compare to your cost of production, including labour and transport?
Check a trusted commodity price portal at least once a week. Many state agriculture departments offer free SMS price alerts. Join a local farmer group — shared market information and collective bargaining beat working alone. Keep a simple record of your own selling prices too. Over a few seasons, your personal log becomes one of the most reliable tools on your farm.
No forecast is perfect. Weather shifts, policy changes, and global events can move prices faster than any chart. Use this guide as a helpful direction, not a promise. The farmers who thrive are the ones who stay informed, stay flexible, and always know their true costs before they negotiate a sale.
❓ Frequently asked questions
What is the current market price for soyabean per kg?
Soyabean averages ₹56 per kg based on 1,376 recorded price observations, with a range from ₹15 to ₹110 per kg. It is the highest-priced crop commodity in the dataset, and the only one with an average above ₹50 per kg.
How much do heifers, cows, and young bulls cost per kg?
Heifers average €6 per kg with a range of €2 to €10, based on 2,034 observations. Cows average €5 per kg, ranging from €2 to €8 across 1,931 observations. Young bulls also average €6 per kg with the same €2–€8 range, drawn from 1,627 observations. All livestock prices in this dataset are recorded in euros.
Which crop commodity has the most volatile prices?
Green Chilli shows the widest crop price range in the dataset, from ₹7 to ₹245 per kg across 2,063 observations, with an average of ₹40 per kg. The ₹245 peak is the largest single price spike recorded for any crop. Wood also has a broad absolute range of ₹1 to ₹180 per kg across 2,347 observations, though it averages only ₹7 per kg, suggesting different wood types or qualities are grouped together under one label.
Where does this price data come from and how reliable is it?
The dataset contains 181,902 price observations sourced from FAOSTAT, covering all countries. Sample and manually entered rows have been excluded. The most recent crop price observations are dated September–October 2026, while livestock observations are from October 2026. Crop and wood prices are denominated in Indian rupees, while livestock prices are in euros, which reflects the different reporting regions behind the data.
📚 Where the figures in this guide come from
We read what has already been published on the subject, take out the figures and rules it actually states, and write it up in plain, everyday language.
Every number and name here traces back to a source listed below — nothing in this guide is invented.
Our own records
Price observations recorded by this site (worldwide)
Prices, rules and animal health advice change and vary by area. Check anything important with a local vet, dealer or agriculture office before you spend money.
Spotted a mistake? Tell us in the comments and we will correct it.





 Menu
💬 Comments
Login to comment
No comments yet. Be the first to share your experience!